Evaluating LLMs for Quality of Clinical Documentation
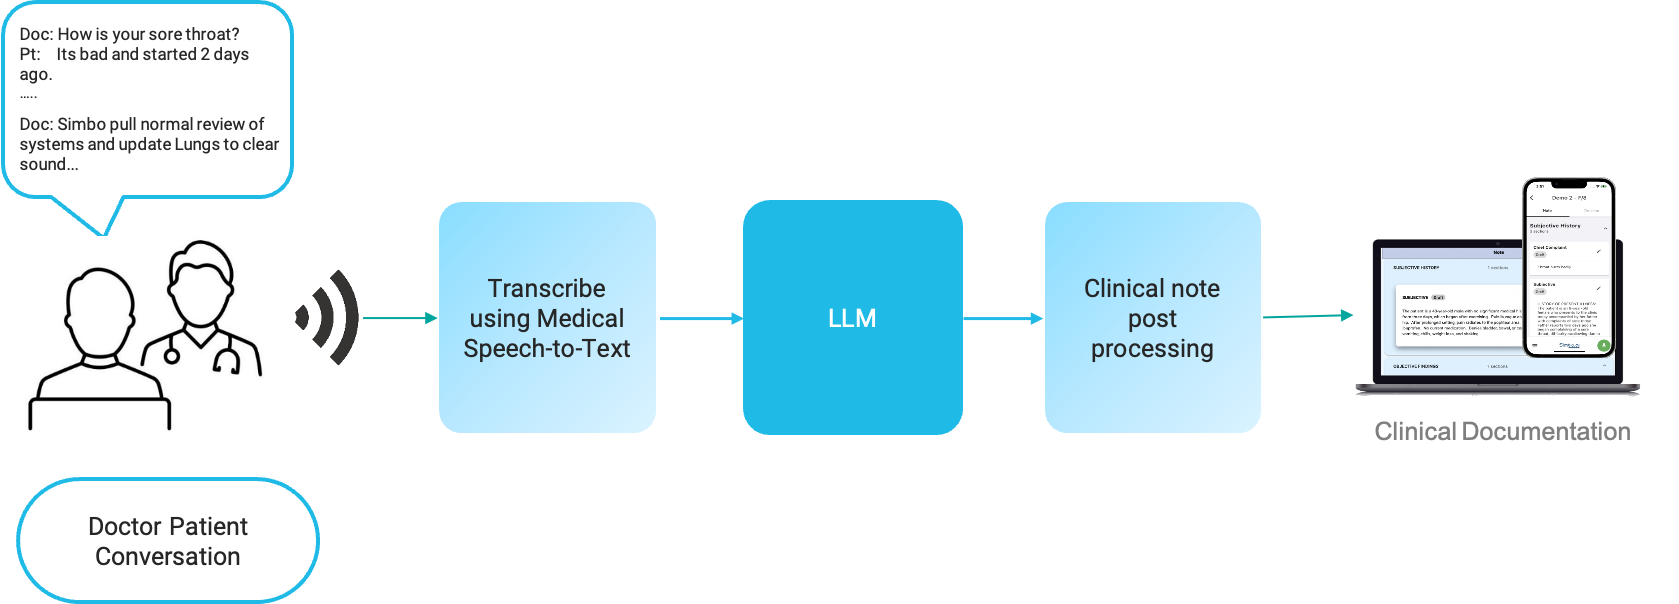
Ambient AI Scribe solutions typically would work by recording patient-doctor conversation, transcribing it, and then send to a Large Language Model (LLM) with a prompt to generate a clinical note or clinical documentation. Clinical notes can be generated using various LLMs like GPT, LLAMA2, Mistral, Claude, Command, Medpalm etc.
Evaluation of LLM for Documentation Quality
Measurement parameters
Following parameters are used to measure the note quality. All parameters are measured for the same prompt.
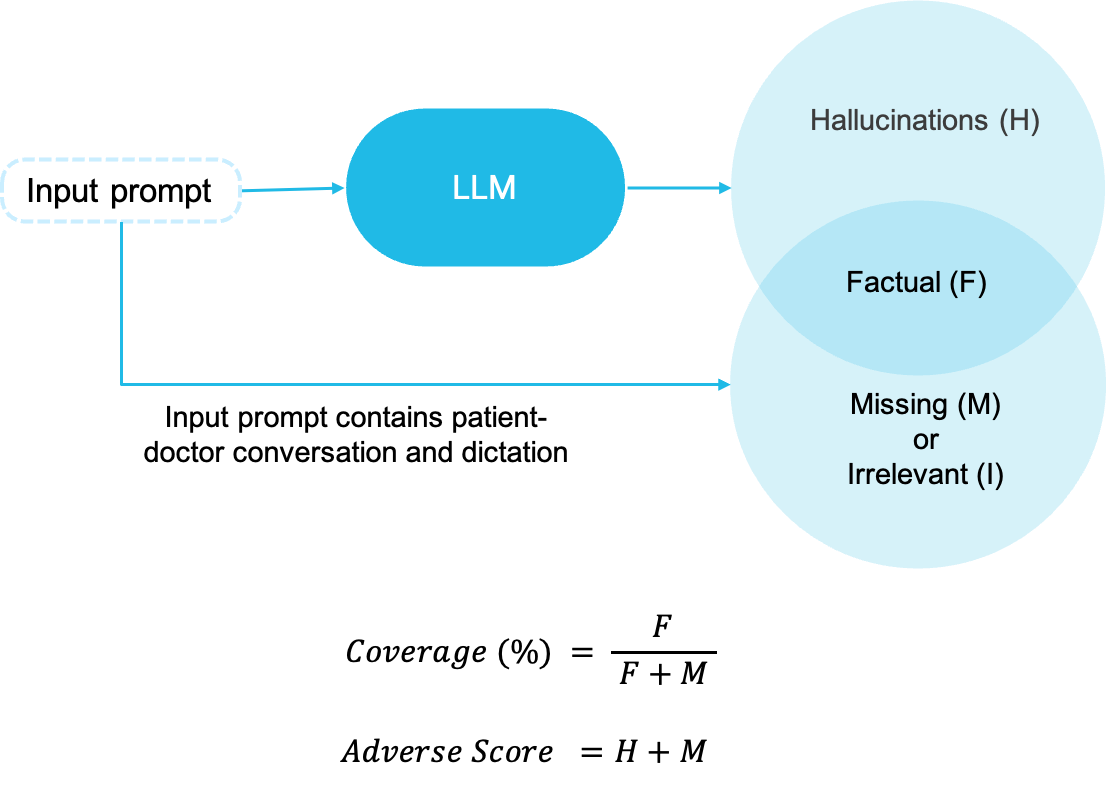
- Hallucinations: Total number of utterances in the output note which are regarded as hallucinations. An utterance is hallucination if it was not discussed or implied during the conversation.
- Coverage: This score implies how much of the relevant note information is covered in the note compared to what is present in the input prompt.
- Adverse Score: This score is sum of hallucinations in the note and missing clinical information. Missing information is the one which was present in the input conversation/dictation but not taken in output note generated by LLMs.
Evaluation of LLM for Single Patient-Visit
Hallucination Variation
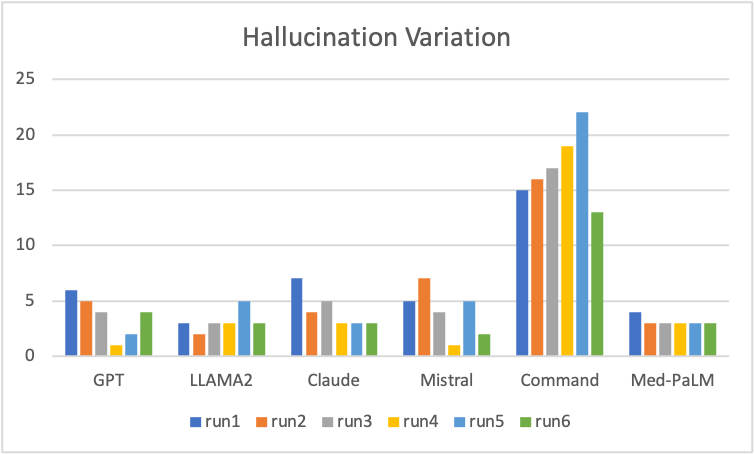
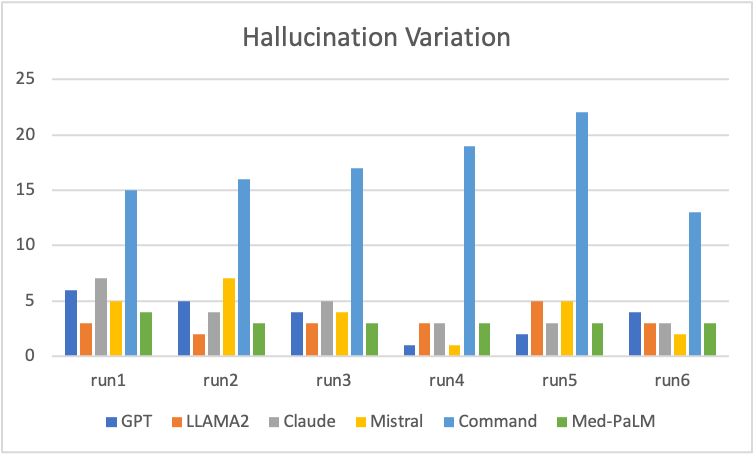
The 2 graphs are created by running same prompt multiple times across multiple LLMs. Some key observations that the hallucinations vary significantly and randomly when same prompt is run multiple times on the same LLM. The hallucinations typically vary from 1 to 7 utterances when runs are repeated without any change. This shows high variability.
Med-PaLM have the hallucinations at same value and does not vary with multiple runs. Command LLM has significantly high hallucinations.
Coverage Score Variation
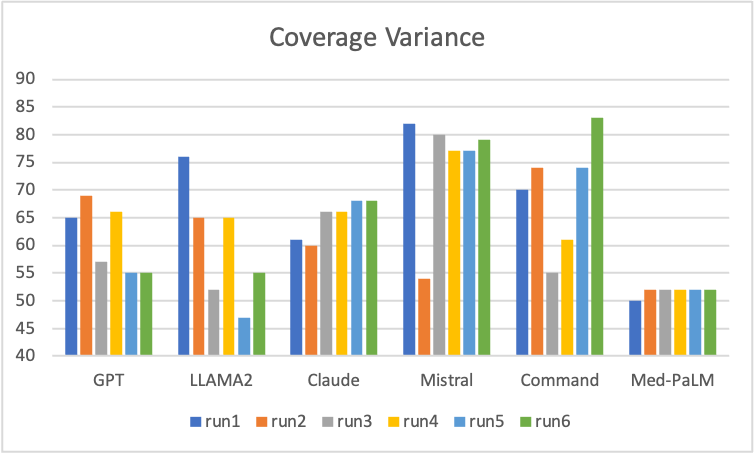
The 2 graphs are created by running same prompt multiple times across multiple LLMs. The scores vary significantly and randomly across multiple runs and across LLMs. Interestingly Command LLM had very high hallucination but its coverage is also quite good. Coverage variesfrom 45% to 85% when runs are repeated without any change. Med-PaLM is showing consistent coverage across multiple runs and is more predictive.
Confidence Score Variation
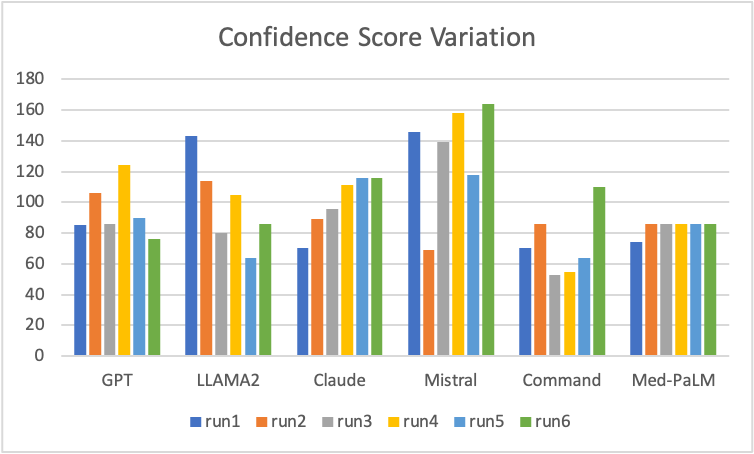
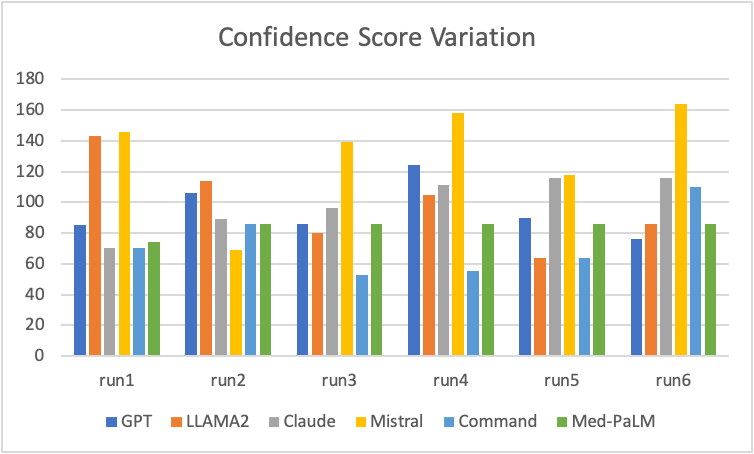
The confidence score is a function of hallucination and coverage score. Confidence score is higher for higher coverage but reduces due to hallucinations. The 2 graphs above are created by running same prompt multiple times across multiple LLMs. The scores vary significantly and randomly across multiple runs and across LLMs. Command LLM shows lower confidence score which is expected due to high hallucinations. Med-PaLM has consistent confidence score showing high repeatability.
Conclusion of Output Variation on Single Patient-visit
These variations are measure for a single patient-visit from primary care outpatient clinic and hence one cannot draw any conclusion on which LLM is better. Here are key observsations:
- The output varies significantly every time you give the same prompt again to same LLM. Each run was run on a new LLM session.
- The outputs are quite random and neither gets better or worse as you run it multiple time.
- The output varies significantly and randomly for exactly same prompt across different LLMs. Observations across 100s of patient-visits shows same pattern.
- Command LLM gives very high hallucinations across all patient-visits. However, it performs better in some specific scenarios.
- Med-PaLM is consistent in its output across the runs.
Evaluation of LLM for Large Number of Patient-visits
LLMs were evaluated for 133 patient-visits from outpatient clinics across 15+ specialties and varying diagnoses. Same prompt body was used for all runs. Only part of the prompt varying was the conversation/dictation transcription. A total of 3 runs were done for each patient-visit and analyzed for quality of the documentation. For each run, each patient-visit was attempted 2 times for each LLM and best output was chosen based on confidence score across 12 outputs (6 LLMs X 2 attempts = 12 outputs). The graph shows how many times each LLM had the best score for each run, giving you a sense on which LLM performs better.
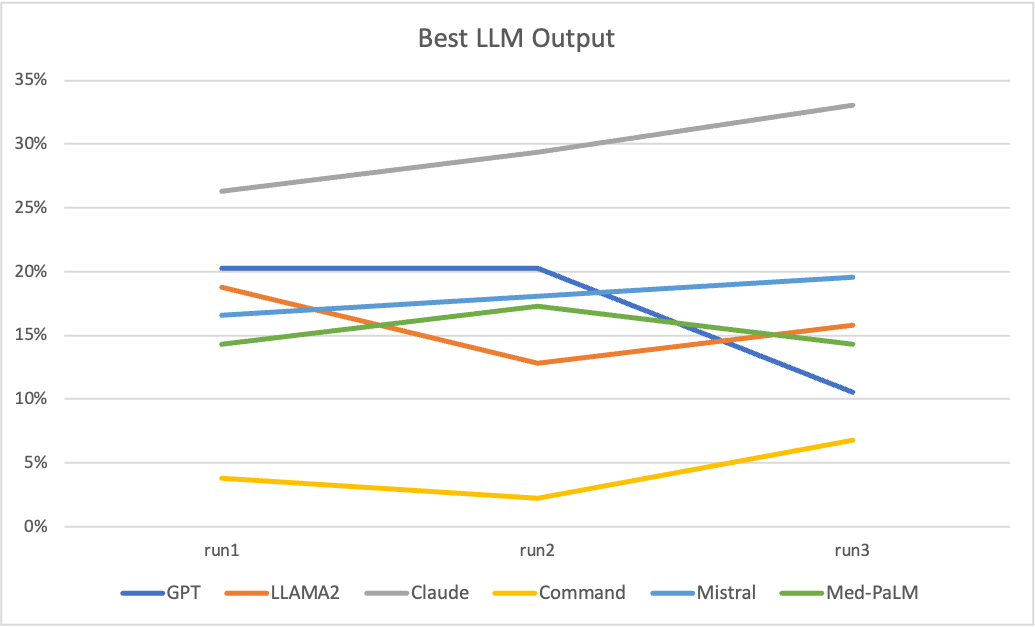
Some key observations:
- There is no single LLM which is a winner. Even the best performing LLM only gets the best output 30% of the time, for remaining 70% other LLMs performs better.
- Claude LLM consistently gives highest number of outputs with highest confidence score.
- Command LLM performs consistently very poorly in this exercise and is rarely giving best output. However, based on our observations it performs best on some niche scenarios specially when all other fail. The reason for poor quality for Command LLM is due to very high hallucinations.
- LLAMA2, GPT, Mistral and Med-PaLM are slightly lower than Claude but contribute significantly in getting a better output.
Comparison of Individual LLM Performance with Simbo
Hallucinations
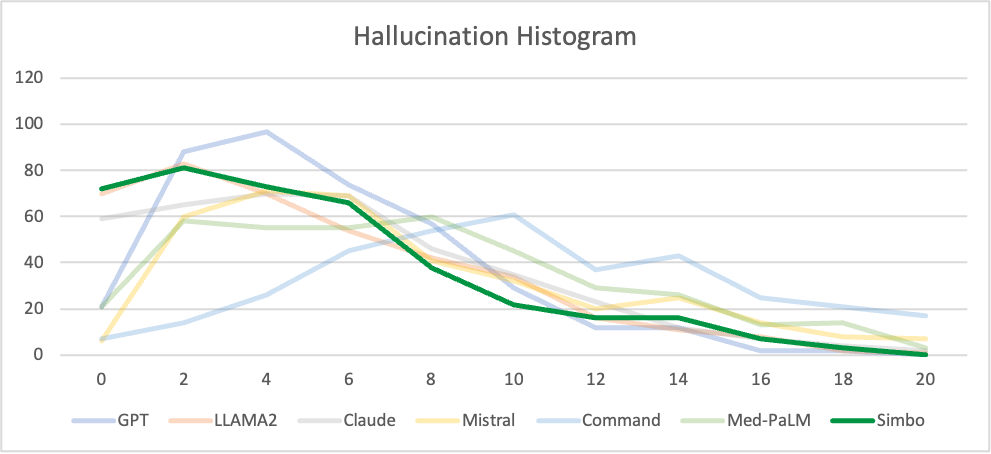
X-axis: Number of hallucination utterances
Y-axis: Frequency of notes
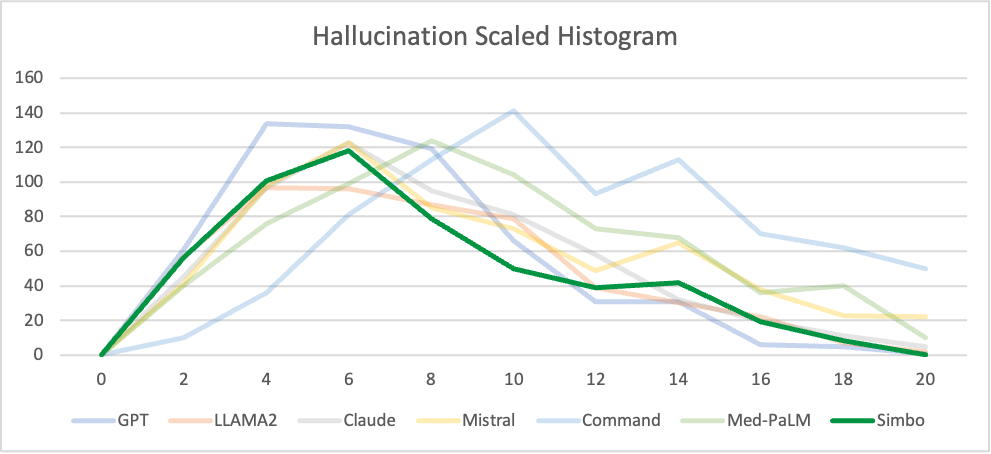
X-axis: Number of hallucination utterances
Y-axis: Frequency of notes x number of hallucination utterances
Key conclusion: Simbo output’s curve shift to left. Left shift implies that Simbo reduces hallucinations. The scaled hallucination shows lower the area under the curve, which implies lower hallucination.
Coverage Score
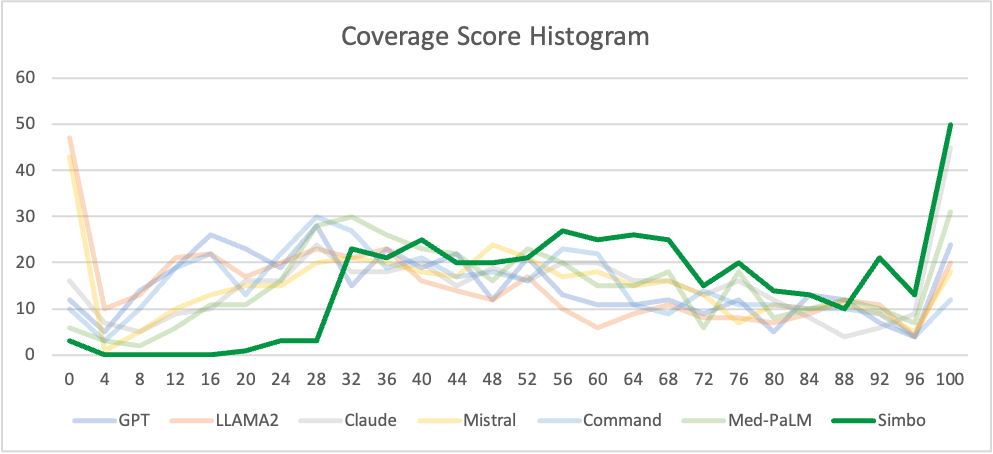
X-axis: Coverage Score
Y-axis: Frequency of notes
Key conclusion: Simbo’s curve shifts to right significantly. Shift to right implies that Simbo gets significantly higher coverage score on the clinical documentation than any other LLM. All LLM curves peak at lower coverage scores implying significant portion of information from input conversation is missed out.
Confidence Score
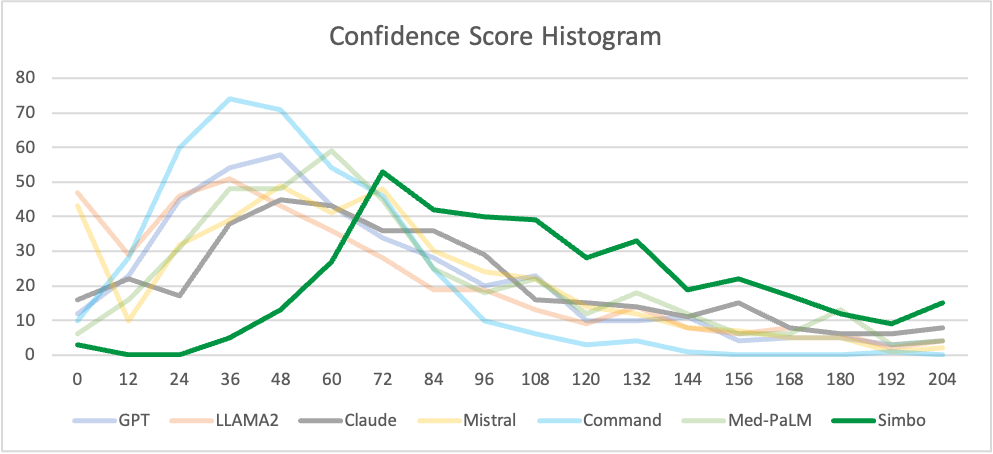
X-axis: Confidence Score
Y-axis: Frequency of notes
Key conclusion: Simbo output’s curve shits to right signifcantly. Shift to right implies that Simbo gets significantly higher confidence score for clinical documentation than any LLM. All LLM curves peak at lower confidence scores implying they seldomly give higher confidence score.